Line 시리즈
주로 시간이나 다른 축 변수에 의한 데이터의 변화 또는 경향(pattern)을 보여주는 데 사용한다.
데이터포인트의 값에 해당하는 지점에 표시되는 데이터포인트 마커들을 연결한 선으로 표시된다.
시리즈 type은 'line'로 지정한다.
또, 설정 옵션 모델은 LineSeriesOptions이고,
차트 구성 요소 모델은 LineSeries이다.
이 시리즈를 기준으로 자동 생성되는 x축은 선형축이다.
Bar 시리즈, Pie 시리즈와 더불어 가장 많이 사용되는 기초적인 차트 시리즈이다.

설정
const config = {
series: {
type: 'line'
data: [155, 138, 122, 133, 114, 113],
}
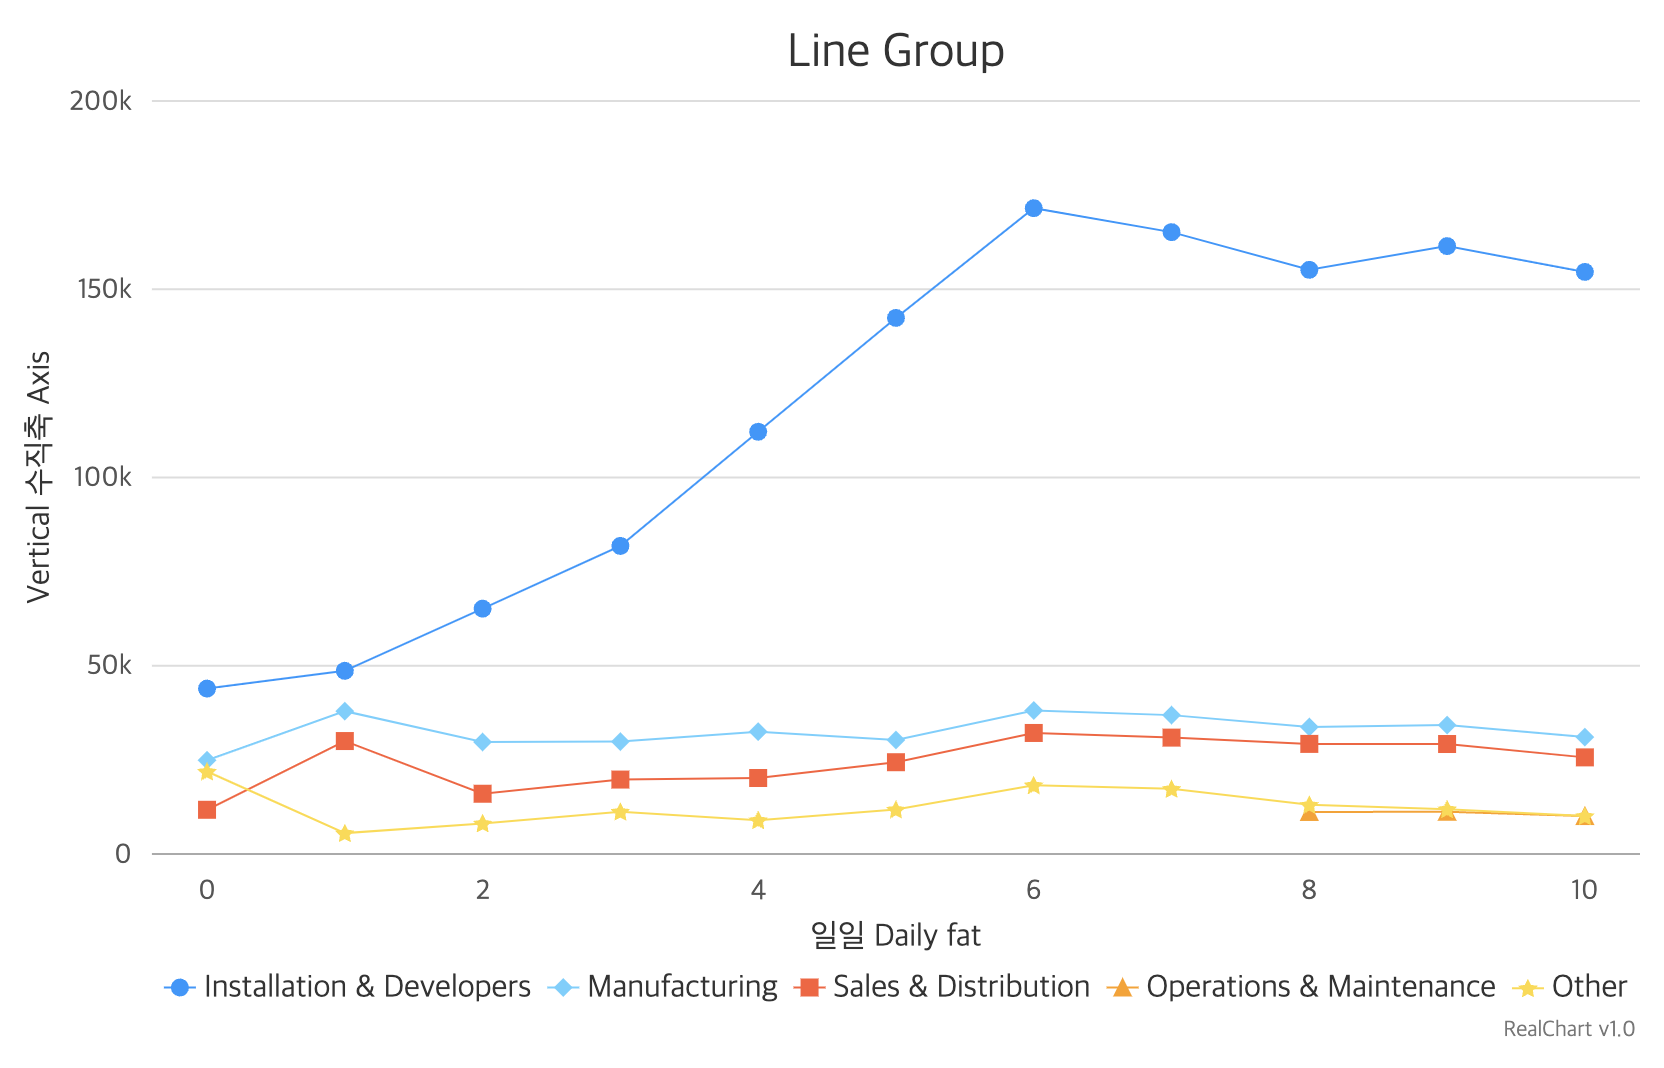
};Line 시리즈 그룹
시리즈그룹 type은 'linegroup'로 지정한다.
또, 설정 옵션 모델은 LineSeriesGroupOptions이고,
차트 구성 요소 모델은 LineSeriesGroup이다.
이 시리즈그룹을 기준으로 자동 생성되는 x축은 선형축이다.
'children' 속성에 자식 시리즈들 배열을 지정한다. 자식들을 설정과 상관없이 'line' 시리즈로 생성된다.
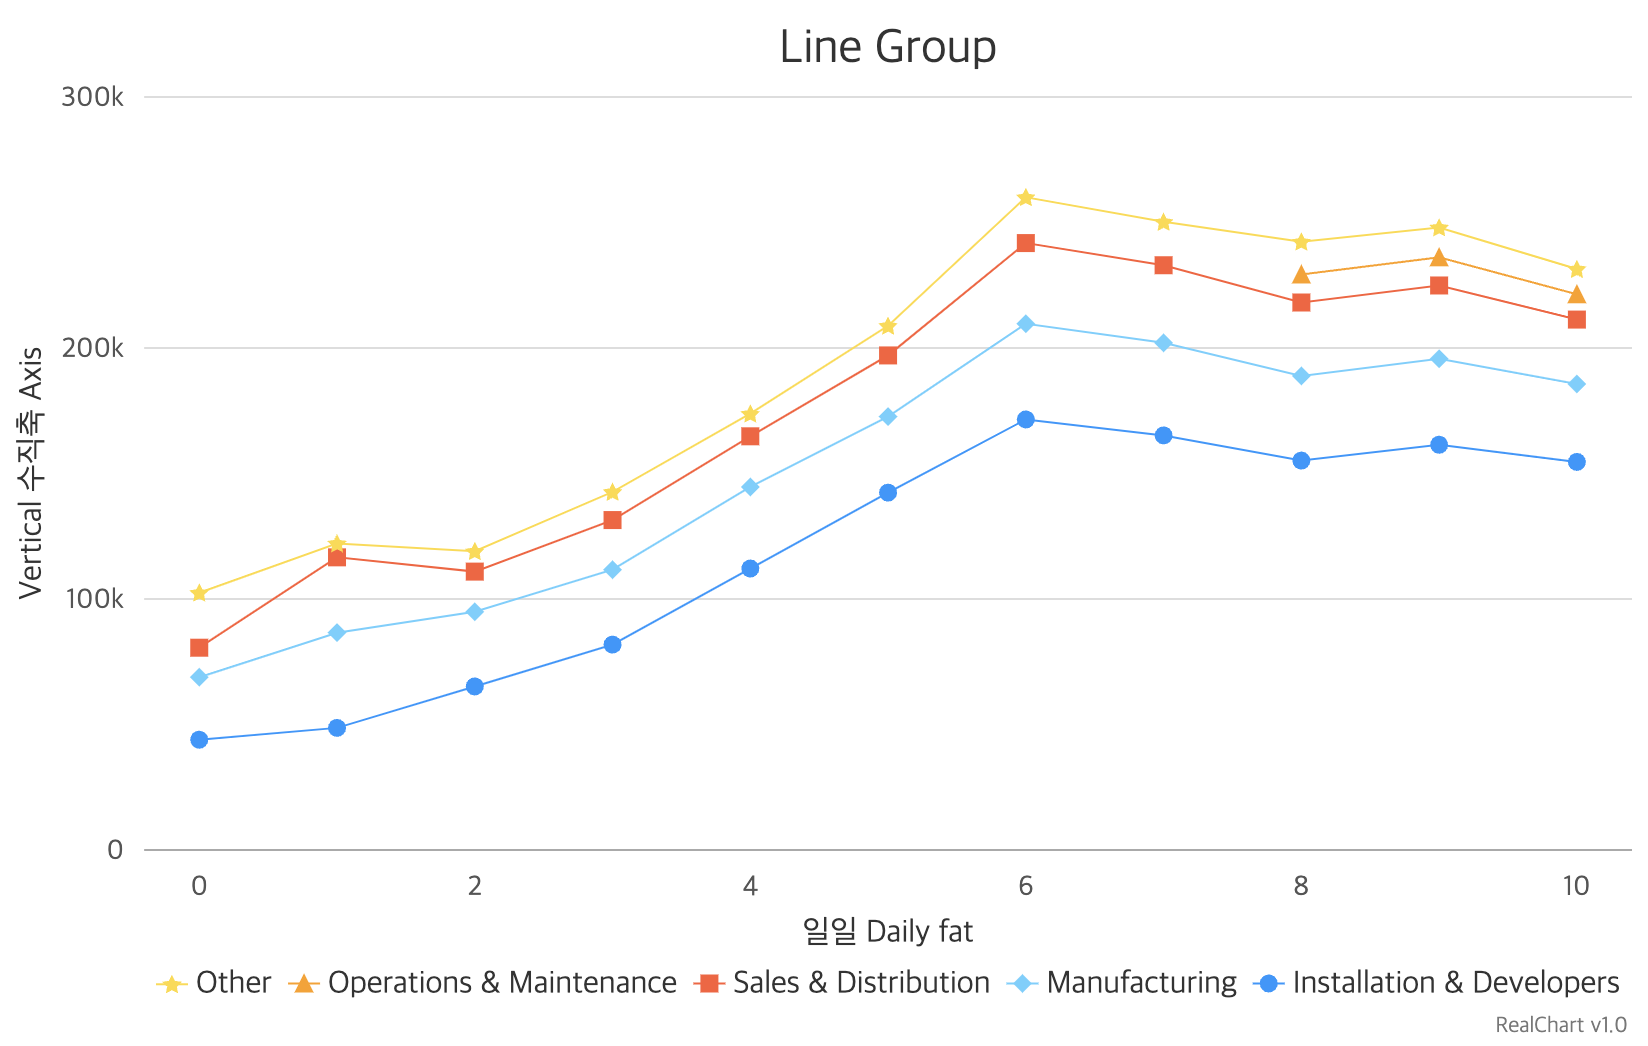
'stack' layout은 시리즈 line들을 아래에서 위로 쌓아서 표시한다.
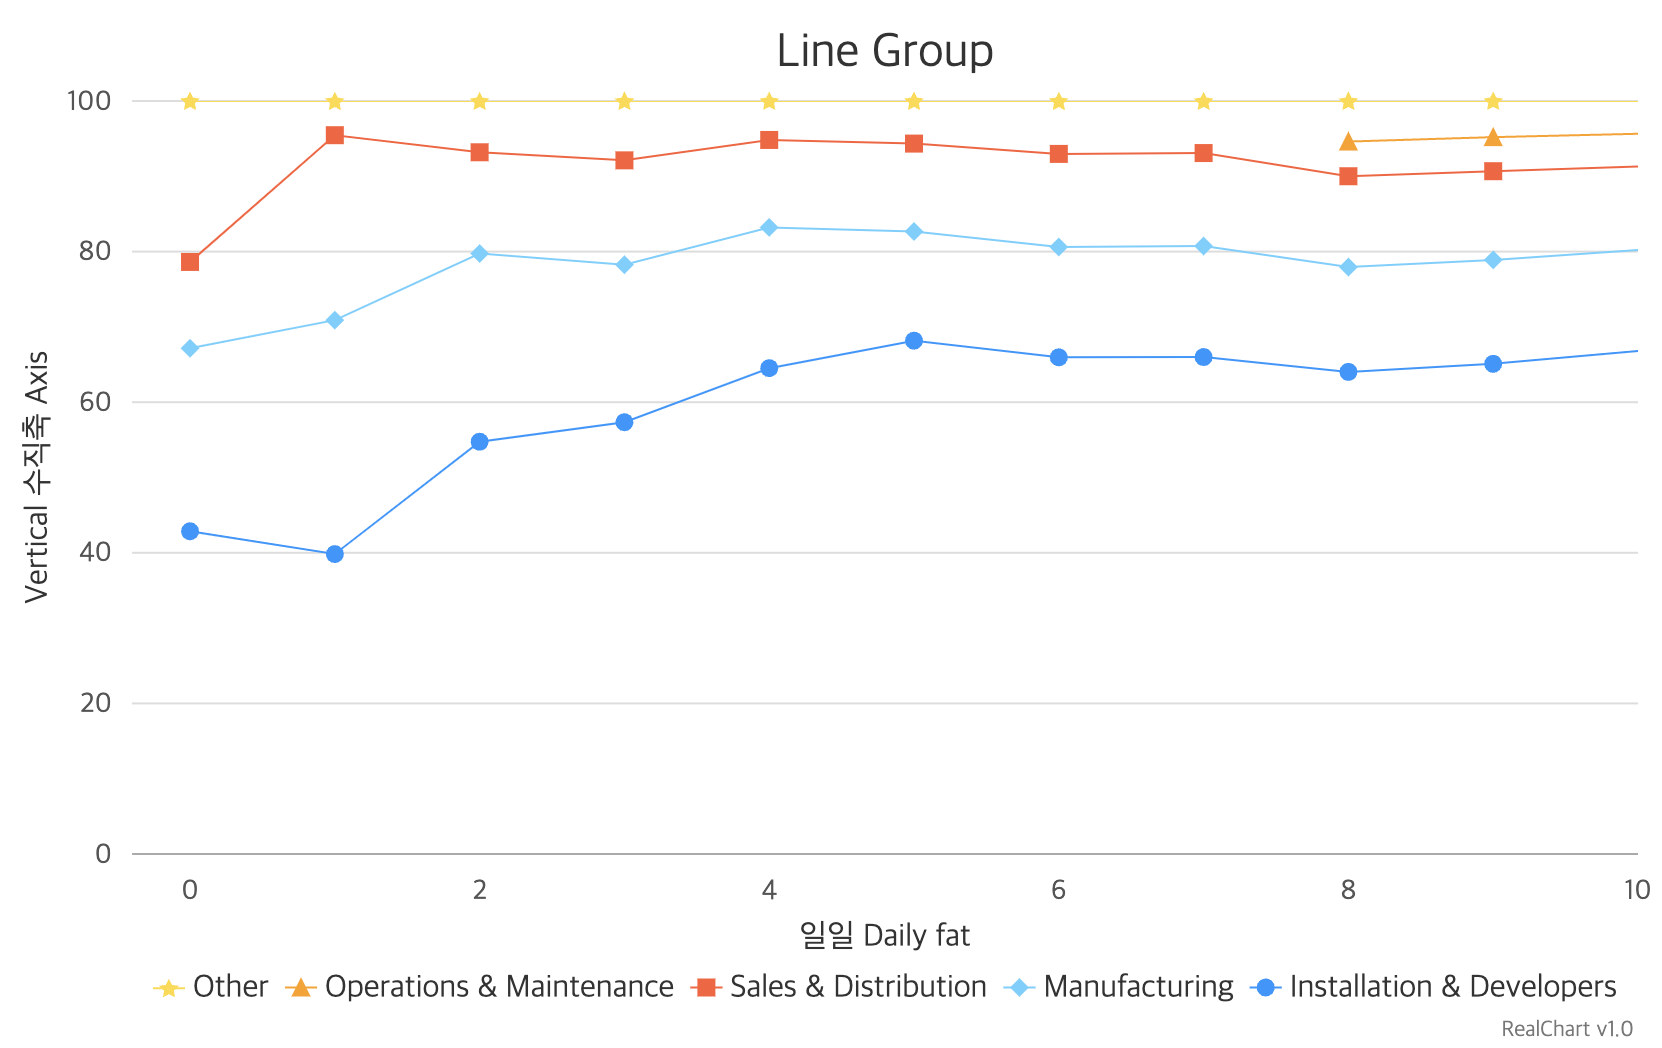
'fill' layout은 시리즈 line들이 y축을 모두 채우도록 아래에서 위로 쌓아서 표시한다. 하나의 값에 위치한 데이터포인트들의 x값 합이 100이 되도록 상대적 비율로 조정해서 area들의 크기를 표시한다.
설정
const config = {
    series: {
        type: 'linegroup',
        layout: 'fill', // 'overlap', 'stack'
        children: [{
        }, {
        }, {
        }]
    }
};
Spline 시리즈
lineType 설정과 무관하게 항상 'spline'으로 표시되는 라인 시리즈이다.
시리즈 type은 'spline'로 지정한다.
또, 설정 옵션 모델은 SplineSeriesOptions이고,
차트 구성 요소 모델은 SplineSeries이다.
설정
const config = {
    series: {
        type: 'spline'
        data: [155, 138, 122, 133, 114, 113],
    }
};